Funnel reports
Funnel reports measure the change in size of a cohort as it passes through or drops off each step in a funnel you define.
The subset that completes the funnel is then further analyzed as a new cohort, showing 1-, 3-, 7-, and 30-day average revenue and retention.
Funnel report results are typically one to six hours behind real-time.
Defining funnel steps
To define a funnel, click the Funnels tab from the main Tapstream dashboard navigation. Then, press Create Funnel.
Give your funnel a human-readable name.
Decide whether to anchor your funnel. The 'Start Anchored' and 'End Anchored' toggles allow you to force the funnel to only match users whose first action is the first step of the funnel, and whose last action is the last step of the funnel.
Now, add steps to your funnel by choosing its steps.
Adding campaign steps to your funnel
Add a campaign step to your funnel if you want to generate a cohort of users that interacted with a certain campaign.
Adding event steps to your funnel
Add an event step to your funnel if you want to analyze the cohort of users who performed a certain action in the app.
Press the + Add another event button. As with hits, the new step will match any event by default. You can narrow its scope by clicking the 'Any' dropdown and changing it to a different match type.
Choosing the 'Exact' match type will present you with a dropdown of all of your event types. The other match types are defined in the table above, and require you to enter a string to be matched against.
Strict and loose step links
Funnel steps can be strictly or loosely linked.
Define your step links as strict if you want to only match timelines that have the exact same sequence of steps as in your funnel definition.
Define your step links as loose if you want a funnel to match a timeline even if other hits and events occur between steps.
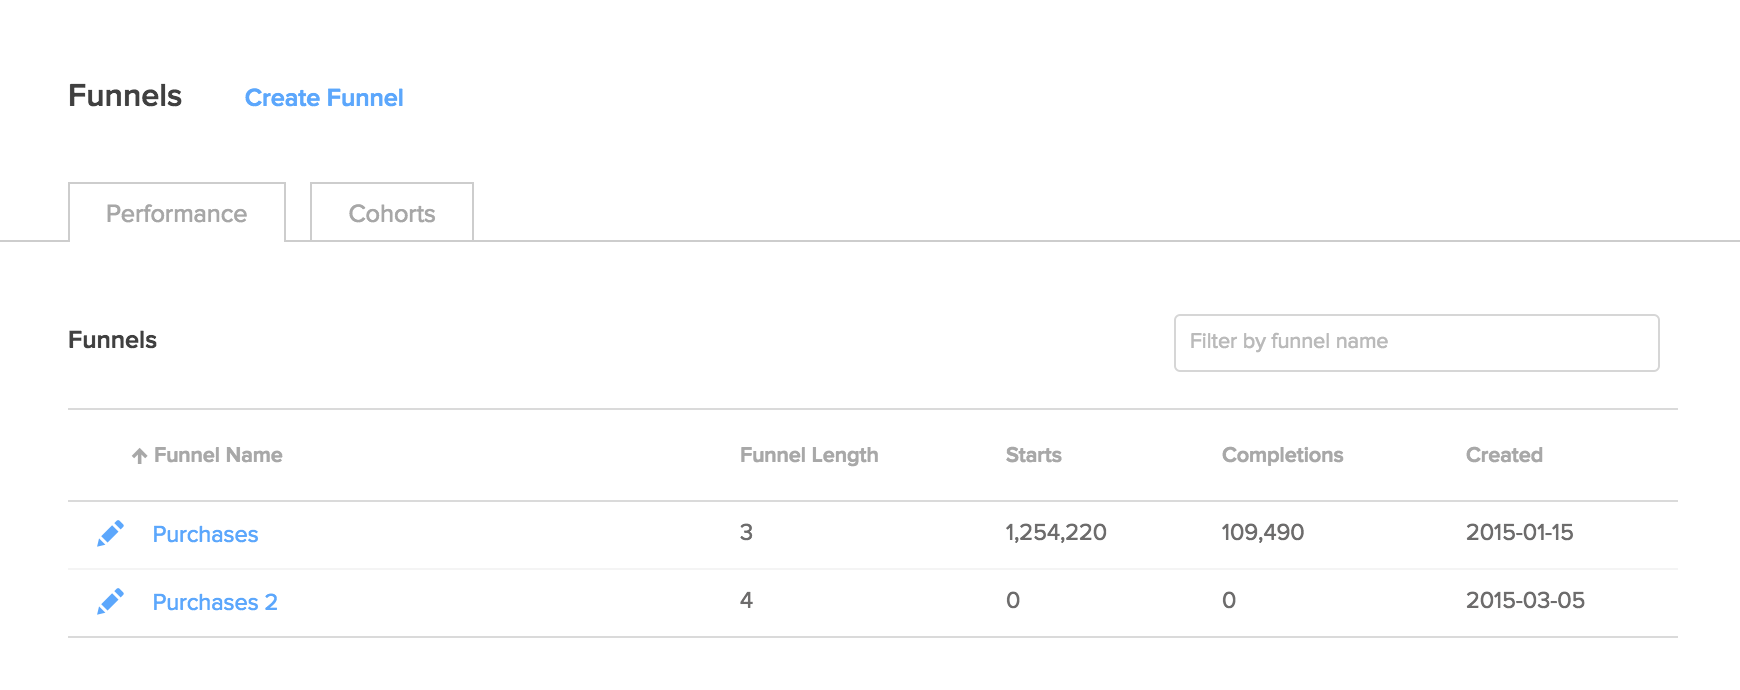
Funnels overview
The Funnels overview screen is accessible from the main Tapstream navigation. It provides two views of your funnel reports: Performance, which shows the length of the funnel, funnel entrances, and funnel completions, and Cohorts, which shows you aggregated revenue and retention metrics for the cohort of users who completed the funnel.
Both of these views respect the date range you set in the top-right of the dashboard.
Funnel details
Each funnel has a Details page. This page shows detailed performance and cohort data scoped to an individual funnel. Your funnels' details pages are accessible by clicking on a funnel's name in the funnels overview screen.
The funnel details page also contains links for editing and deleting the funnel.
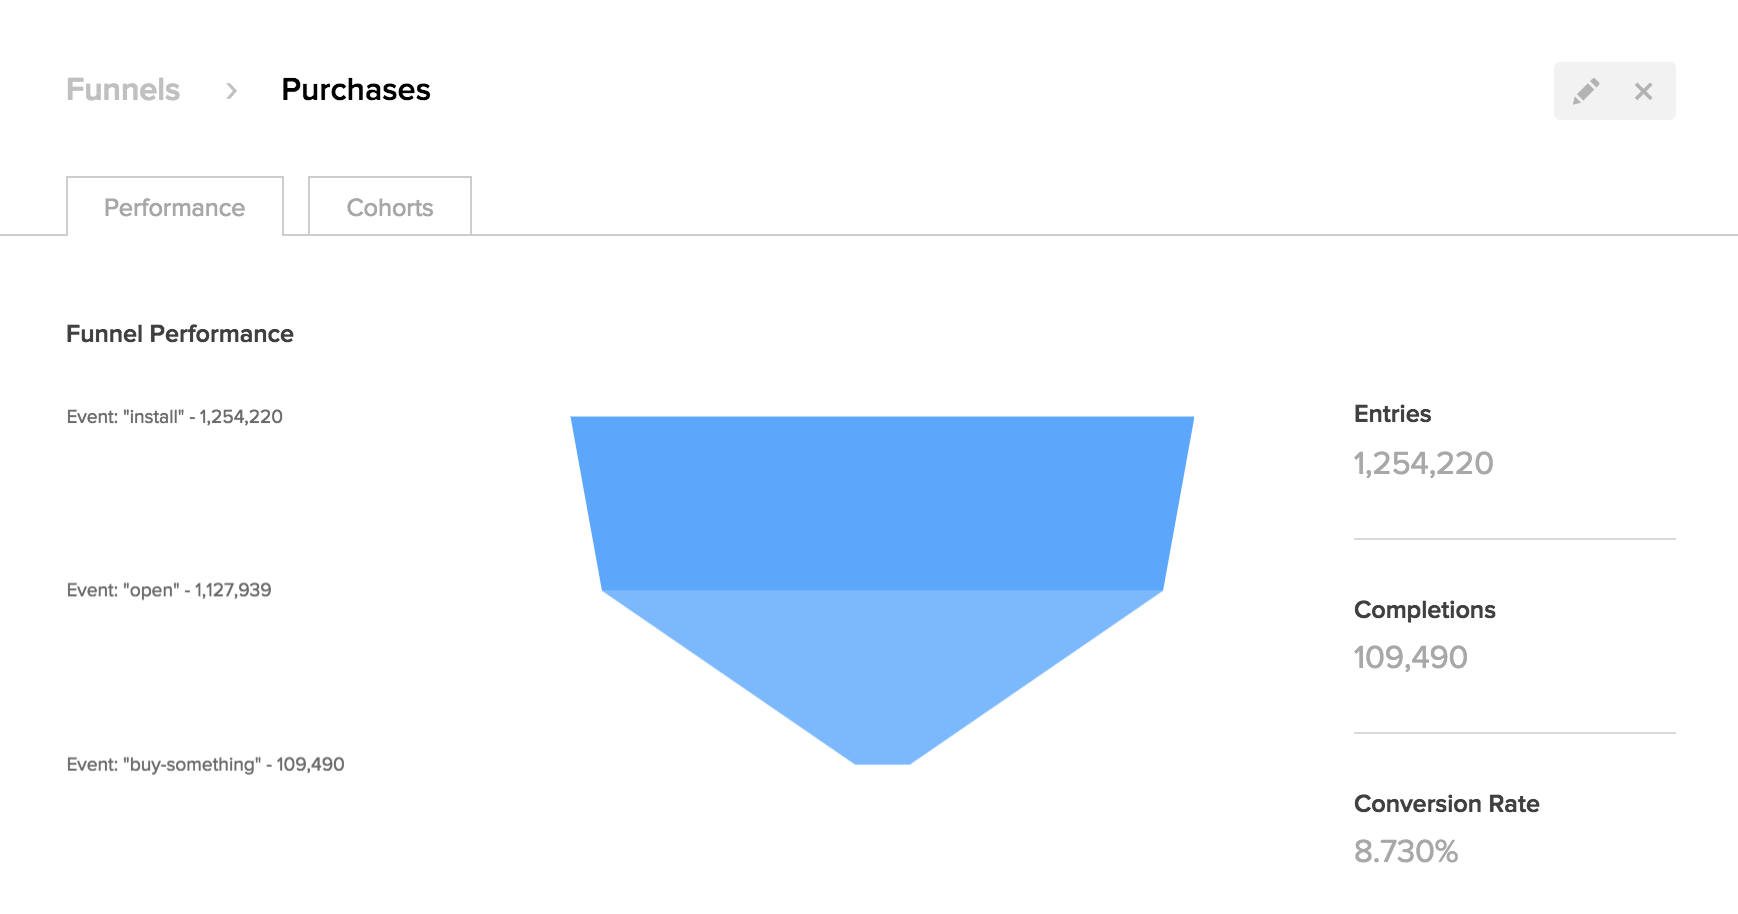
Funnel details, Performance
The Performance tab of the funnel's details screen shows you a funnel chart and table, displaying the number of completions and dropoffs at each funnel step.
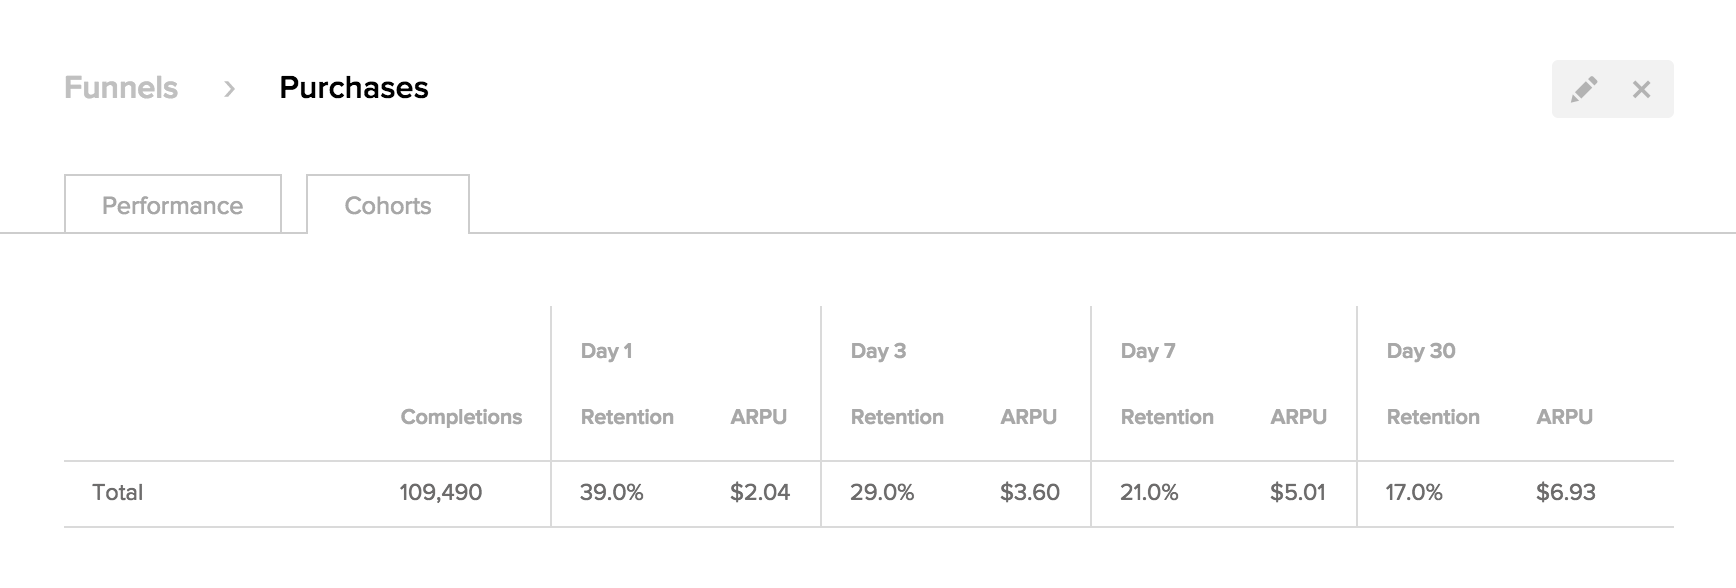
Funnel details, Cohorts
The Cohorts tab of a funnel's details screen shows you aggregate evenue and retention for the cohort of users who completed the funnel.